

Suppose that you have been asked by an HR manager at Engineering Company XYZ to help her
Question:
Suppose that you have been asked by an HR manager at Engineering Company XYZ to help her to develop a recruiting budget for newly-hired engineers. She wants to predict the average recruiting costs for these hires as a function of the salary that was accepted by the newly-hired engineers based on data from the previous 6 months. You have decided to use a correlation and simple linear regression analysis, and to test your Excel skills, you have collected the data of a random sample of newly-hired engineers. These hypothetical data appear in Fig. 6.33.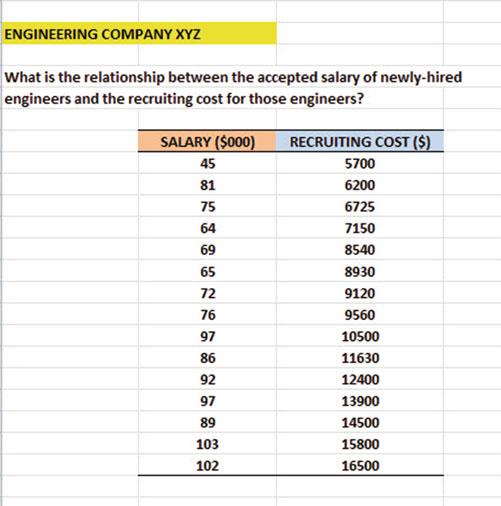
(a) create an Excel spreadsheet using RECRUITING COST ($) as the criterion and SALARY ($000) as the predictor using the following format:
– Top title: RELATIONSHIP BETWEEN SALARY AND RECRUITING COST – x-axis title: SALARY ($000)
– y-axis title: RECRUITING COST ($)
– Re-size the chart so that it is 7 columns wide and 25 rows long – Delete the legend – Delete the gridlines – Move the chart below the table
(b) Create the least-squares regression line for these data on the scatterplot.
(c) Use Excel’s regression function to find the equation for the least-squares regression line for these data and display the results below the chart on your spreadsheet.
(d) Use number format (two decimal places) for the correlation and the y-intercept on the SUMMARY OUTPUT, and use number format (four decimal places) for all of the other decimal figures in the SUMMARY OUTPUT.
(e) Print the input data and the chart so that this information fits onto one page.
(f) Then, print the regression output table so that this information fits onto a separate page.
(g) Save the file as: RECRUITING2
Step by Step Answer:


Excel 2013 For Human Resource Management Statistics A Guide To Solving Practical Problems
ISBN: 97173
2nd Edition
Authors: Thomas J. Quirk, Julie Palmer Schuyler
