Suppose that you wanted to study the relationship between DIET (measured in calories allowed per day) and
Question:
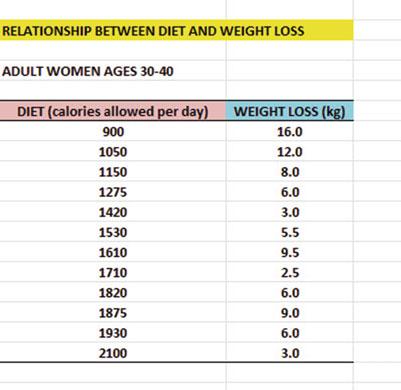
Suppose that you wanted to study the relationship between DIET (measured in calories allowed per day) and WEIGHT LOSS (measured in kilograms, kg) for adult women between the ages of 30 and 40 who are overweight for their height and body structure, and who all weigh roughly the same number of kilograms before undertaking the weight loss program. You want to test your Excel skills on a random sample of these women based on their weight change over the past 4 months to make sure that you can do this type of research. The hypothetical data appear in Fig. 6.35:
Create an Excel spreadsheet and enter the data using DIET (calories allowed per day) as the independent variable (predictor) and WEIGHT LOSS (kg) as the dependent variable (criterion). Underneath the table, use Excel’s ¼correl function to find the correlation between these two variables. Label the correlation and place it underneath the table; then round off the correlation to two decimal places.
(a) create an XY scatterplot of these two sets of data such that:
• top title: RELATIONSHIP BETWEEN DIET AND WEIGHT LOSS • x-axis title: DIET (calories allowed per day)
• y-axis title: WEIGHT LOSS (kg)
• move the chart below the table • re-size the chart so that it is 8 columns wide and 25 rows long • delete the legend • delete the gridlines
(b) Create the least-squares regression line for these data on the scatterplot, and add the regression equation to the chart.
(c) Use Excel to run the regression statistics to find the equation for the leastsquares regression line for these data and display the results below the chart on your spreadsheet. Use number format (two decimal places) for the correlation and three decimal places for all other decimal figures, including the coefficients.
(d) Print just the input data and the chart so that this information fits onto one page. Then, print the regression output table on a separate page so that it fits onto that separate page.
(e) save the file as: DIET3
Step by Step Answer:

Excel 2013 For Human Resource Management Statistics A Guide To Solving Practical Problems
ISBN: 97173
2nd Edition
Authors: Thomas J. Quirk, Julie Palmer Schuyler


