

Suppose that you worked for a large engineering company with locations in various cities within the USA.
Question:
Suppose that you worked for a large engineering company with locations in various cities within the USA. “Employee turnover” is a critical factor in the success of every business since talented and experienced employees are difficult to replace if they decide to leave the company. Suppose that you have collected the turnover rate data presented in Fig. 8.6 by randomly sampling your company’s locations for each of the four departments of your company. You have been asked to analyze the data to determine if there was a significant difference in the turnover rate between the four departments over the past year.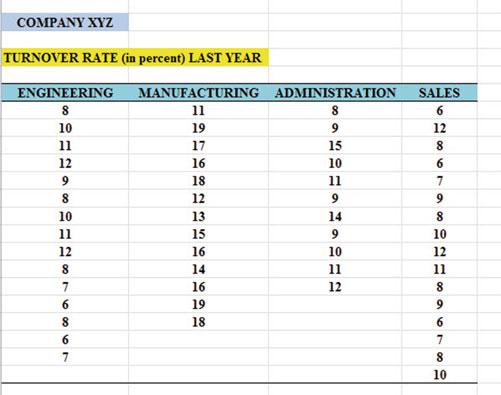
(a) Enter these data on an Excel spreadsheet.
(b) Perform a one-way ANOVA test on these data, and show the resulting ANOVA table underneath the input data for the four departments.
(c) If the F-value in the ANOVA table is significant, create an Excel formula to compute the ANOVA t-test comparing the average for MANUFACTURING against SALES and show the results below the ANOVA table on the spreadsheet (put the standard error and the ANOVA t-test value on separate lines of your spreadsheet, and use one decimal place for each value)
(d) Print out the resulting spreadsheet so that all of the information fits onto one page
(e) Save the spreadsheet as: Turnover8
Step by Step Answer:


Excel 2013 For Human Resource Management Statistics A Guide To Solving Practical Problems
ISBN: 97173
2nd Edition
Authors: Thomas J. Quirk, Julie Palmer Schuyler
