

Question: Table 9.8 shows the results (mean daily throughput) obtained from 30 replications with the manufacturing model in Exercise E9.4. Each replication has been run for
Table 9.8 shows the results (mean daily throughput) obtained from 30 replications with the manufacturing model in Exercise E9.4. Each replication has been run for a period of 100 days after the warm-up period, which is deleted from the data. Determine the number of replications that should be performed with the model using:
a) The graphical method
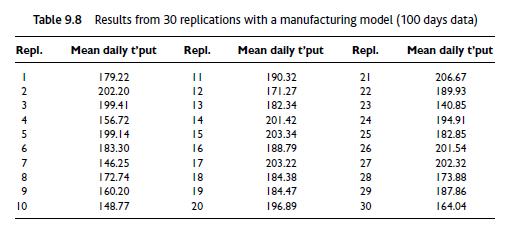
b) The confidence interval method (assume the client wishes to obtain less than 10 per cent deviation and then less than 5 per cent deviation in the confidence interval from the mean)
Note: these data are available in a spreadsheet (Exercise9.xls) on the companion web site.
Table 9.8 Results from 30 replications with a manufacturing model (100 days data) Repl. Mean daily t'put Repl. Mean daily t'put Repl. Mean daily t'put 10 -234567890 179.22 II 190.32 202.20 12 171.27 199.41 13 182.34 156.72 14 201.42 199.14 15 203.34 183.30 16 188.79 146.25 17 203.22 172.74 18 184.38 160.20 19 184.47 148.77 20 196.89 2222222222 21 206.67 189.93 23 140.85 24 194.91 25 182.85 26 201.54 27 202.32 28 173.88 29 187.86 30 164.04
Step by Step Solution
There are 3 Steps involved in it

Get step-by-step solutions from verified subject matter experts