

15.4. Table 15.19, the data file Credit at the text website, shows data for a sample of...
Question:
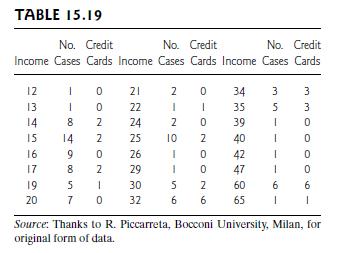
15.4. Table 15.19, the data file Credit at the text website, shows data for a sample of 100 adults randomly selected for an Italian study on the relation between annual income and having a travel credit card, such as American Express or Diners Club. At each level of annual income
(in thousands of euros), the table indicates the number of subjects in the sample and the number of those having at least one travel credit card. Let x = annual income and y = whether have a travel credit card (1 = yes, 0 = no).
For instance, for the five observations at x = 30, y = 1 for two subjects and y = 0 for three subjects. Using software,
(a) find the logistic regression prediction equation, and
(b) fit the probit model. In each case, interpret the estimated effect and show the change in the estimated probability between the lowest and the highest income values.
Attach software output to your solution.
Step by Step Answer:


Statistical Methods For The Social Sciences
ISBN: 9781292220314
5th Global Edition
Authors: Alan Agresti
