

Question: Refer to Table 6.11. The Pearson test of independence has X 2 (I) = 6.88. For equally spaced scores, the CochranArmitage trend test has z
Refer to Table 6.11. The Pearson test of independence has X2(I) = 6.88. For equally spaced scores, the Cochran€”Armitage trend test has z2= 6.67 (P = 0.01). Interpret, and explain why results differ so. Analyze the data using a linear logit model. Test independence using the Wald and likelihood-ratio tests, and compare results to the Cochran€”Armitage test. Check the fit of the model, and interpret.
Table 6.11:
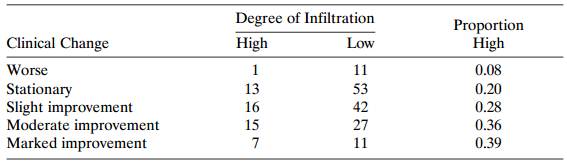
Degree of Infiltration Proportion High Clinical Change High Low 11 53 42 27 Worse 0.08 Stationary Slight improvement Moderate improvement Marked improvement 13 16 15 0.20 0.28 0.36 0.39 11
Step by Step Solution
3.23 Rating (164 Votes )
There are 3 Steps involved in it
The CochranArmitage test u... View full answer

Get step-by-step solutions from verified subject matter experts