Question:
The data in Appendix 5.A (Lai and Xing, 2008, p. 71) denote log-returns on six stocks, with monthly observations from August 2000 to October 2005, where PFE=Pfizer, INTEL=Intel, CITI=Citigroup, AXP=American Express, XOM=Exxon-
Mobil, GM=General Motors. In addition, the data include log-returns for 3TB=3-month treasury bill rate and the SP500.

Transcribed Image Text:
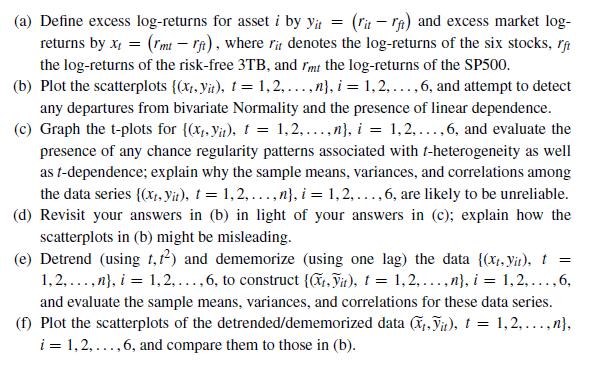
(a) Define excess log-returns for asset i by yit = (it) and excess market log- returns by x = (rmtr), where rit denotes the log-returns of the six stocks, rft the log-returns of the risk-free 3TB, and rmt the log-returns of the SP500. (b) Plot the scatterplots {(x,yit), t = 1,2,...,n), i = 1,2,..., 6, and attempt to detect any departures from bivariate Normality and the presence of linear dependence. (c) Graph the t-plots for {(x,y), t = 1,2,...,n), i = 1,2,..., 6, and evaluate the presence of any chance regularity patterns associated with t-heterogeneity as well as t-dependence; explain why the sample means, variances, and correlations among the data series {(x, yit), t = 1, 2,..., n}, i = 1,2,..., 6, are likely to be unreliable. (d) Revisit your answers in (b) in light of your answers in (c); explain how the scatterplots in (b) might be misleading. (e) Detrend (using t, f) and dememorize (using one lag) the data {(x,yit), t = 1,2,...,n), i = 1, 2,..., 6, to construct {.it), t = 1,2,...,n), i = 1,2,..., 6, and evaluate the sample means, variances, and correlations for these data series. (f) Plot the scatterplots of the detrended/dememorized data (x,t), t = 1, 2,..., n}, i = 1, 2,..., 6, and compare them to those in (b).


