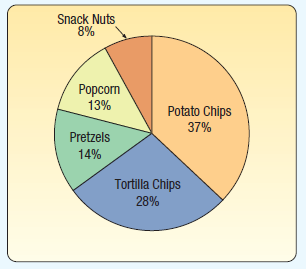
During the 50th Super Bowl, 30 million pounds of snack food were eaten. The chart below depicts
Question:
During the 50th Super Bowl, 30 million pounds of snack food were eaten. The chart below depicts this information.

a. What is the name given to this graph?b. Estimate, in millions of pounds, the amount of potato chips eaten during the game.c. Estimate the relationship of potato chips to popcorn. (twice as much, half as much, three times, none of these?pick one)d. What percent of the total do potato chips and tortilla chips comprise?
Fantastic news! We've Found the answer you've been seeking!
Step by Step Answer:
Related Book For 

Statistical Techniques in Business and Economics
ISBN: 978-1259666360
17th edition
Authors: Douglas A. Lind, William G Marchal
Question Posted:


