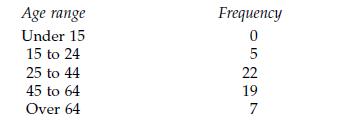
The ages of savers opening accounts at a bank are given in the grouped frequency distribution below.
Question:
The ages of savers opening accounts at a bank are given in the grouped frequency distribution below. Produce a histogram to depict this distribution.

Here not only do the classes have different widths, but the first and last do not have a numerical beginning and end, they are ‘open-ended’. Before we can plot a histogram we must ‘close’ them. For the first class this is straightforward, we can express it as ‘0 to 14’.
The last class is problematic: if we knew the age of the oldest saver that could be the upper limit of the class, but as we don’t we must select an arbitrary yet plausible class end. To reflect the style of other classes we could use ‘65 to 84’.
Fantastic news! We've Found the answer you've been seeking!
Step by Step Answer:
Related Book For 

Question Posted:


