

10. Quality Control A manufacturer recorded the number of defective items (y) produced on a given day...
Question:
10. Quality Control A manufacturer recorded the number of defective items (y) produced on a given day by each of 10 machine operators and also recorded the average output per hour ( ) 1 x for each operator and the time in weeks from the last machine service (X2 ) .
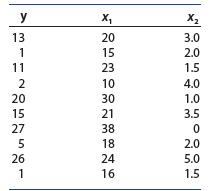
The printout that follows resulted when these data were analyzed using the MINITAB package using the model:
![]()
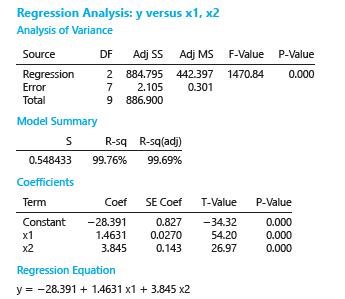
a. Interpret R2 and comment on the fit of the model.
b. Is there evidence to indicate that the model contributes significantly to the prediction of y at the a 5.01 level of significance?
c. What is the prediction equation relating ˆy and 1 x when 4 2 x 5 ?
d. Use the fitted prediction equation to predict the number of defective items produced for an operator whose average output per hour is 25 and whose machine was serviced 3 weeks ago.
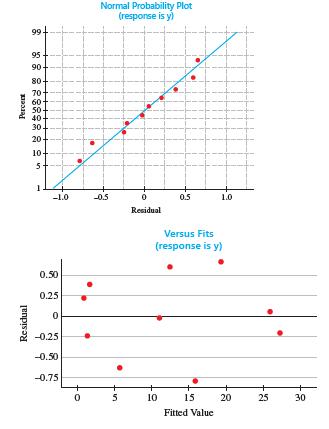
e. What do the residual plots tell you about the validity of the regression assumptions?
Step by Step Answer:


Introduction To Probability And Statistics
ISBN: 9780357114469
15th Edition
Authors: William Mendenhall Iii , Robert Beaver , Barbara Beaver
