

10.48 Sampling distribution of x1 - x2 Refer to Example 12, which compared two groups of seven...
Question:
10.48 Sampling distribution of x1 - x2 Refer to Example 12, which compared two groups of seven dogs each in terms of their time interacting with their owners. The following graph shows a smoothed version of the sampling distribution of x1 - x2 derived from the permutation approach. Superimposed (in blue) is the theoretical sampling distribution of x1 - x2 if the sample sizes were large.
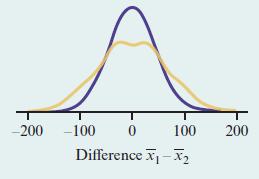
a. What would the mean, standard error, and approximate shape of the theoretical sampling distribution of x1 - x2 be if the sample sizes were large?
b. Comment on how the permutation sampling distribution of x1 - x2 differs from the theoretical, large-sample one.
c. Consider the one-sided alternative Ha: m1 7 m2. If the actually observed difference in sample means were 100, would the P-values computed from each sampling distribution be the same or different? Explain.
Step by Step Answer:

This question has not been answered yet.
You can Ask your question!


Statistics The Art And Science Of Learning From Data
ISBN: 9781292164878
4th Global Edition
Authors: Alan Agresti, Christine A. Franklin, Bernhard Klingenberg
