

10.80 TV watching and race The 2014 GSS asked about the number of hours you watch TV...
Question:
10.80 TV watching and race The 2014 GSS asked about the number of hours you watch TV per day. An analysis that evaluates this by race shows the results (note the codes:
1 = Black and 2 = White):
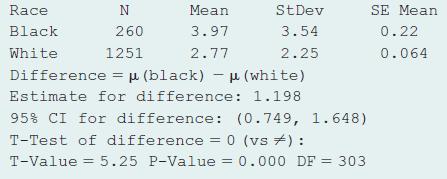
a. Do you believe that TV watching has a normal distribution for each race? Why or why not? What effect does this have on inference comparing population means?
b. Explain how to interpret the reported confidence interval. Can you conclude that one population mean is higher? If so, which one? Explain.
c. On what assumptions is this inference based?
Fantastic news! We've Found the answer you've been seeking!
Step by Step Answer:

Answered By
Pushpinder Singh
Currently, I am PhD scholar with Indian Statistical problem, working in applied statistics and real life data problems. I have done several projects in Statistics especially Time Series data analysis, Regression Techniques.
I am Master in Statistics from Indian Institute of Technology, Kanpur.
I have been teaching students for various University entrance exams and passing grades in Graduation and Post-Graduation.I have expertise in solving problems in Statistics for more than 2 years now.I am a subject expert in Statistics with Assignmentpedia.com.
3+ Reviews
10+ Question Solved
Related Book For 

Statistics The Art And Science Of Learning From Data
ISBN: 9781292164878
4th Global Edition
Authors: Alan Agresti, Christine A. Franklin, Bernhard Klingenberg
Question Posted:
