

11.51 Study hours and grades The following table shows data on study hours per week and the...
Question:
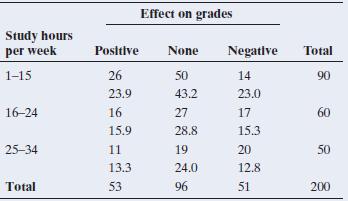
11.51 Study hours and grades The following table shows data on study hours per week and the effect on grades, with expected cell counts given underneath the observed counts for 200 college students in a study conducted by Washington’s Public Interest Research Group (PIRG).
a. Suppose the variables were independent. Explain what this means in this context.
b. Explain what is meant by an expected cell count.
Show how to get the expected cell count for the first cell, for which the observed count is 26.
c. Compare the expected cell frequencies to the observed counts. Based on this, what is the profile of subjects who tend to have (i) positive effect on grades than independence predicts and (ii) negative effect on grades than independence predicts.
Step by Step Answer:


Statistics The Art And Science Of Learning From Data
ISBN: 9781292164878
4th Global Edition
Authors: Alan Agresti, Christine A. Franklin, Bernhard Klingenberg
