

12. Gestation Times and Longevity The following table shows the gestation time in days and the average
Question:
12. Gestation Times and Longevity The following table shows the gestation time in days and the average longevity in years for a variety of mammals in captivity; the potential life span of animals is rarely attained for animals in the wild
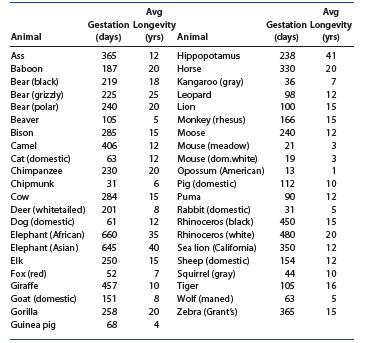
a. Draw a scatterplot for the data.
b. Describe the form, direction, and strength for the pattern in the scatterplot.
c. Are there any outliers or other unusual data points in the set? If so, to which animals do these data points correspond?
d. Remove the outliers or unusual data points from the set, and reconstruct the scatterplot. Does it appear that a straight line is appropriate for describing the data?
Step by Step Answer:

This question has not been answered yet.
You can Ask your question!


Introduction To Probability And Statistics
ISBN: 9780357114469
15th Edition
Authors: William Mendenhall Iii , Robert Beaver , Barbara Beaver
