

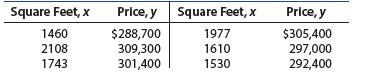
13. Housing Prices The data in the table give the square footages and sales prices of n512...
Question:
13. Housing Prices The data in the table give the square footages and sales prices of n512 houses randomly selected from those sold in a small city.
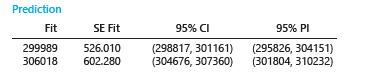
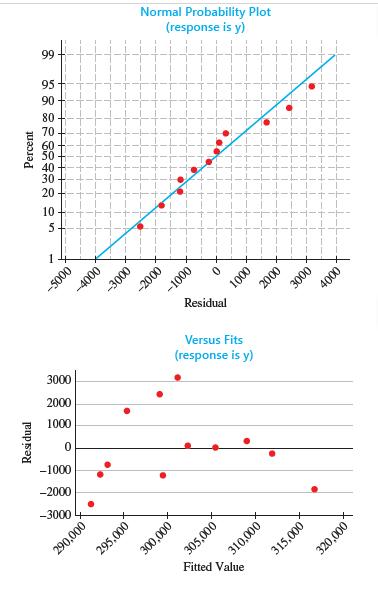
Use the partial MINITAB printout to answer the questions.
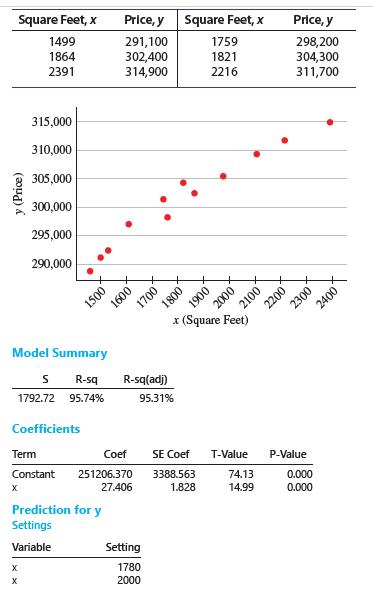
a. Can you see any pattern other than a linear relationship in the original plot?
b. The value of r2 for these data is .9574. What does this tell you about the fit of the regression line?
c. Look at the accompanying diagnostic plots for these data. Do you see any pattern in the residuals? Does this suggest that the relationship between price and square feet is something other than linear?
Step by Step Answer:

This question has not been answered yet.
You can Ask your question!
Related Book For 

Introduction To Probability And Statistics
ISBN: 9780357114469
15th Edition
Authors: William Mendenhall Iii , Robert Beaver , Barbara Beaver
Question Posted:
