

13. Sampling Plans The distribution of x using sampling plans with two different sample sizes are shown
Question:
13. Sampling Plans The distribution of x using sampling plans with two different sample sizes are shown in the graphs that follow
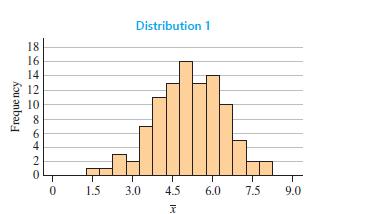
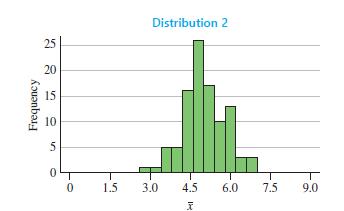
The mean of the population from which these samples came is equal to m 55.5. Which of these two sampling plans would you choose in estimating the population mean? Explain.
Fantastic news! We've Found the answer you've been seeking!
Step by Step Answer:

Answered By
Anthony Ngatia
I have three academic degrees i.e bachelors degree in Education(English & Literature),bachelors degree in business administration(entrepreneurship option),and masters degree in business administration(strategic management) in addition to a diploma in business management.I have spent much of my life in the academia where I have taught at high school,middle level colleges level and at university level.I have been an active academic essays writer since 2011 where I have worked with some of the most reputable essay companies based in Europe and in the US.I have over the years perfected my academic writing skills as a result of tackling numerous different assignments.I do not plagiarize and I maintain competitive quality in all the assignments that I handle.I am driven by strong work ethics and a firm conviction that I should "Do Unto others as I would Like them to do to me".
76+ Reviews
152+ Question Solved
Related Book For 

Introduction To Probability And Statistics
ISBN: 9780357114469
15th Edition
Authors: William Mendenhall Iii , Robert Beaver , Barbara Beaver
Question Posted:
