

13.34 More residuals for strength Refer to the previous exercise. The following figure is a residual plot
Question:
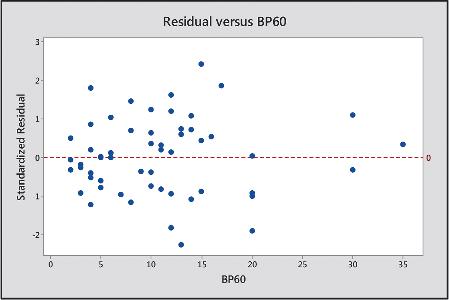
13.34 More residuals for strength Refer to the previous exercise.
The following figure is a residual plot for the model relating maximum bench press to LP200 and BP60. It plots the standardized residuals against the values of BP60. Does this plot suggest any irregularities with the model? Explain.
Step by Step Answer:

This question has not been answered yet.
You can Ask your question!
Related Book For 

Statistics The Art And Science Of Learning From Data
ISBN: 9781292164878
4th Global Edition
Authors: Alan Agresti, Christine A. Franklin, Bernhard Klingenberg
Question Posted:
