

2. Track Stats! To investigate the effect of a training program on the time to complete the...
Question:
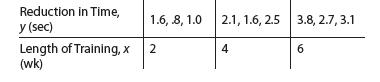
2. Track Stats! To investigate the effect of a training program on the time to complete the 100-yard dash, nine students were placed in the program. The reduction y in time to complete the race was measured for three students at the end of 2 weeks, for three at the end of 4 weeks, and for three at the end of 6 weeks of training. The data are given in the table.
a. Plot the data. Do the data appear to have a linear relationship?
b. Find the least-squares line. Graph the line along with the data points as a check on your calculations.
c. Construct the ANOVA table and use two different test statistics (t and F) to test whether x and y are linearly related. Use the p-value approach.
Step by Step Answer:

This question has not been answered yet.
You can Ask your question!


Introduction To Probability And Statistics
ISBN: 9780357114469
15th Edition
Authors: William Mendenhall Iii , Robert Beaver , Barbara Beaver
