

2.84 Market share for food sales The pie chart shown was displayed in an article in The...
Question:
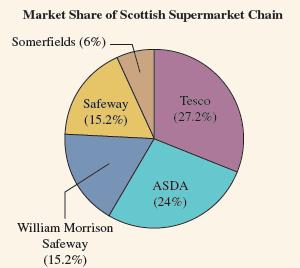
2.84 Market share for food sales The pie chart shown was displayed in an article in The Scotsman newspaper
(January 15, 2005) to show the market share of different supermarkets in Scotland.
a. Pie charts can be tricky to draw correctly. Identify two problems with this chart.
b. From looking at the graph without inspecting the percentages, would it be easier to identify the mode using this graph or using a bar graph? Why?
Step by Step Answer:

This question has not been answered yet.
You can Ask your question!
Related Book For 

Statistics The Art And Science Of Learning From Data
ISBN: 9781292164878
4th Global Edition
Authors: Alan Agresti, Christine A. Franklin, Bernhard Klingenberg
Question Posted:
