

Question: 4. Based on the plot of all the data in part 1, plot the data from 1987 through 1997 and find the best-fitting line for
4. Based on the plot of all the data in part 1, plot the data from 1987 through 1997 and find the best-fitting line for this time period. How good is the fit over this time period? Follow the instructions and answer these same questions for the data for the period from 1998 through 2008.
The phrase “made in the U.S.A.” has become a familiar battle cry as U.S. workers try to protect their jobs from overseas competition. For the past few decades, a major trade imbalance in the United States has been caused by a flood of imported goods that enter the country and are sold at lower cost than comparable American-made goods. One prime concern is the automotive industry, in which the number of imported cars steadily increased during the 1970s and 1980s. The U.S. automobile industry has been besieged with complaints about product quality, worker layoffs, and high prices, and has spent billions in advertising and research to produce an American-made car that will satisfy consumer demands. Have they been successful in stopping the flood of imported cars purchased by American consumers?
The data in the table represent the numbers of imported cars y sold in the United States (in millions) for the years 1969–2015.26 To simplify the analysis, we have coded the year using the coded variable x=Year-1969
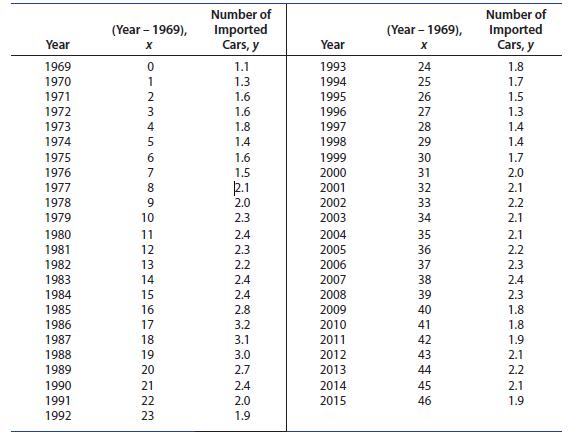
Number of (Year - 1969), Imported (Year - 1969), Year X Cars, y Year x Number of Imported Cars, y 1969 1970 1971 1972 1973 1974 1975 1976 1977 1978 1979 10 01234567899 1.1 1993 24 1.8 1.3 1994 25 1.7 1.6 1995 26 1.5 1.6 1996 27 1.3 1.8 1997 28 1.4 1.4 1998 29 1.4 1.6 1999 30 1.7 1.5 2000 31 2.0 12.1 2001 32 2.1 2.0 2002 33 2.2 2.3 2003 34 2.1 1980 11 1981 12 12 1982 13 1983 14 222N 2.4 2004 35 2.1 2.3 2005 36 2.2 2.2 2006 37 2.3 2.4 2007 38 2.4 1984 15 2.4 2008 39 2.3 1985 16 2.8 2009 40 1.8 1986 17 3.2 2010 41 1987 18 3.1 2011 1988 1989 1990 1991 1992 22222 19 3.0 2012 20 2.7 2013 21 2.4 2014 2.0 2015 444444 1.8 42 1.9 43 2.1 2.2 45 2.1 46 1.9 23 1.9
Step by Step Solution
There are 3 Steps involved in it

Get step-by-step solutions from verified subject matter experts