

3. Use the fitted line to predict the number of imported cars for the years 2013, 2014,...
Question:
3. Use the fitted line to predict the number of imported cars for the years 2013, 2014, and 2015. How do the predictions compare to the actual number of imports for these years?
What does this say about using a fitted model to predict values more than 25 years beyond the fitted time period?
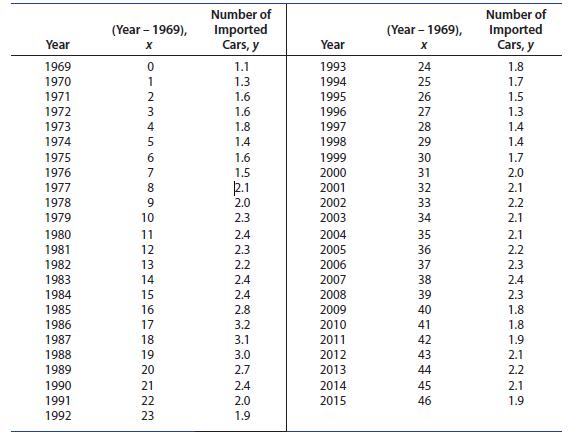
The phrase “made in the U.S.A.” has become a familiar battle cry as U.S. workers try to protect their jobs from overseas competition. For the past few decades, a major trade imbalance in the United States has been caused by a flood of imported goods that enter the country and are sold at lower cost than comparable American-made goods. One prime concern is the automotive industry, in which the number of imported cars steadily increased during the 1970s and 1980s. The U.S. automobile industry has been besieged with complaints about product quality, worker layoffs, and high prices, and has spent billions in advertising and research to produce an American-made car that will satisfy consumer demands. Have they been successful in stopping the flood of imported cars purchased by American consumers?
The data in the table represent the numbers of imported cars y sold in the United States (in millions) for the years 1969–2015.26 To simplify the analysis, we have coded the year using the coded variable x=Year-1969
Step by Step Answer:


Introduction To Probability And Statistics
ISBN: 9780357114469
15th Edition
Authors: William Mendenhall Iii , Robert Beaver , Barbara Beaver
