

4. The normal probability plot and the residuals versus fitted values were generated using the MINITAB regression
Question:
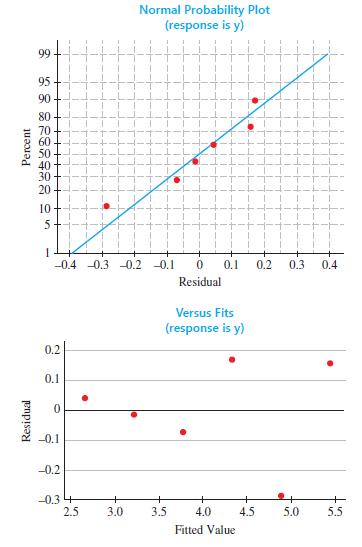
4. The normal probability plot and the residuals versus fitted values were generated using the MINITAB regression analysis program for the data that follow
(
Exercise 18, Section 12.1).
![]()
Does it appear that any regression assumptions have been violated? Explain.
Step by Step Answer:

This question has not been answered yet.
You can Ask your question!
Related Book For 

Introduction To Probability And Statistics
ISBN: 9780357114469
15th Edition
Authors: William Mendenhall Iii , Robert Beaver , Barbara Beaver
Question Posted:
