

7. Election Results The 2016 election was a race in which Donald Trump defeated Hillary Clinton and...
Question:
7. Election Results The 2016 election was a race in which Donald Trump defeated Hillary Clinton and other candidates, winning 304 electoral votes, or 57% of the 538 available. However, Trump only won 46.1% of the popular vote, while Clinton won 48.2%.
The popular vote (in thousands) for Donald Trump in each of the 50 states is listed as follows18:
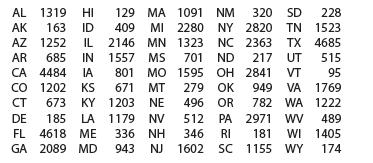
a. By just looking at the table, what shape do you think the distribution for the popular vote by state will have?
b. Draw a relative frequency histogram to describe the distribution of the popular vote for President Trump in the 50 states.
c. Did the histogram in part b confirm your guess in part a? Are there any outliers? How can you explain them?
Step by Step Answer:

This question has not been answered yet.
You can Ask your question!


Introduction To Probability And Statistics
ISBN: 9780357114469
15th Edition
Authors: William Mendenhall Iii , Robert Beaver , Barbara Beaver
