

Question: Critical Thinking Look at the two normal curves in Figures 6-12 and 6-13. Which has the larger standard deviation? What is the mean of the
Critical Thinking Look at the two normal curves in Figures 6-12 and 6-13. Which has the larger standard deviation? What is the mean of the curve in Figure 6-12?
What is the mean of the curve in Figure 6-13?AppendixLO1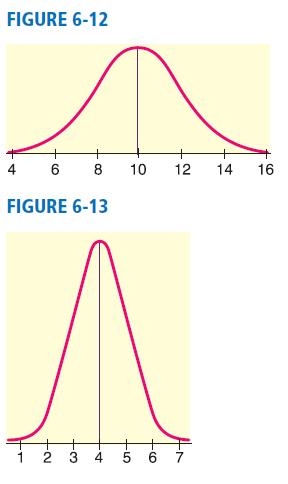
FIGURE 6-12 4 6 8 10 12 14 16 FIGURE 6-13 2 3 4 -co -5
Step by Step Solution
There are 3 Steps involved in it
1 Expert Approved Answer
Step: 1 Unlock

Question Has Been Solved by an Expert!
Get step-by-step solutions from verified subject matter experts
Step: 2 Unlock
Step: 3 Unlock