

Question: Critical Thinking: Normality Consider the following data. The summary statistics, histogram, and normal quantile plot were generated using Minitab. 27 27 27 28 28 28
Critical Thinking: Normality Consider the following data. The summary statistics, histogram, and normal quantile plot were generated using Minitab.
27 27 27 28 28 28 28 28 28 29 29 29 29 29 29 29 29 29 29 30 30 30 30 30 30 30 30 30 30 30 30 31 31 31 31 31 31 31 31 32 32 32 32 33 33 33 33 33 34 34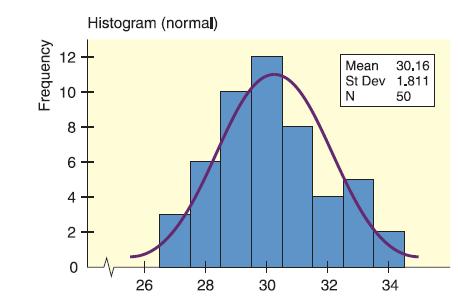
Variable N N* Mean Se Mean StDev Data 50 0 30.160 0.256 1.811 Variable Minimum Q1 Median Q3 Maximum Data 27.000 29.000 30.000 31.000 34.000.
(a) Does the histogram indicate normality for the data distribution? Explain.
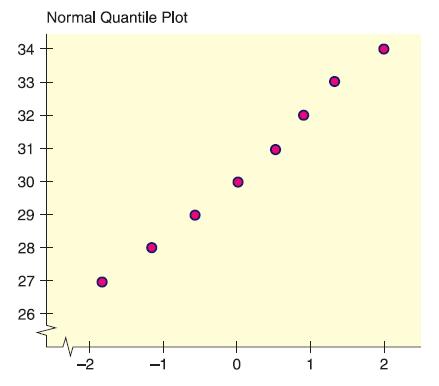
(b) Does the normal quantile plot indicate normality for the data distribution? Explain.
(c) Compute the interquartile range and check for outliers.
(d) Compute Pearson’s index. Does the index value indicate skewness?
(e) Using parts
(a) through (d), would you say the data are from a normal distribution?AppendixLO1
Histogram (normal) 1 Frequency + 10 10 + + 8 6 + + + 2 0 26 28 Mean 30.16 St Dev 1.811 N 50 30 30 32 32 34
Step by Step Solution
There are 3 Steps involved in it

Get step-by-step solutions from verified subject matter experts