

Question: Interpretation Consider graphs (a) and (b) below showing the interest rates of a mortgage loan for new homes from 2015 to 2019. (a) What are
Interpretation Consider graphs
(a) and
(b) below showing the interest rates of a mortgage loan for new homes from 2015 to 2019.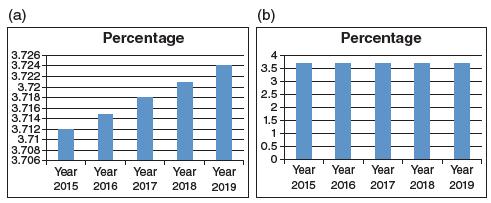
(a) What are the differences in graph
(a) and graph (b)?
(b) Suppose someone claimed that interest rates have increased dramatically. Explain whether or not this is a true statement.AppendixLO1
(a) 3.726 3.724 3.722- Percentage (b) 4 3.5 3 Percentage 3.72- 2.5 3.718 3.716 2 3.714- 1.5 3.712- 1 3.71- 0.5 3.708 3.706+ 0 Year Year Year Year 2015 2016 2017 2018 2019 Year Year Year Year Year Year 2015 2016 2017 2018 2019
Step by Step Solution
There are 3 Steps involved in it
1 Expert Approved Answer
Step: 1 Unlock

Question Has Been Solved by an Expert!
Get step-by-step solutions from verified subject matter experts
Step: 2 Unlock
Step: 3 Unlock