

Question: Interpretation The graph below is information from a survey of 1000 pet owners who were asked to identify the types of pets they had at
Interpretation The graph below is information from a survey of 1000 pet owners who were asked to identify the types of pets they had at home.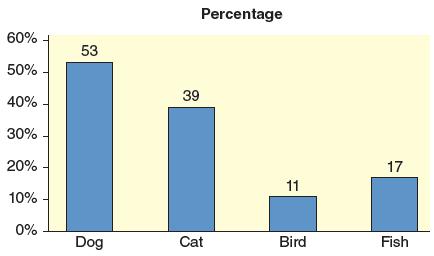
Is it possible to make a circle graph using the information provided in the graph? Explain why or why not.AppendixLO1
Percentage 60% 53 50% 39 40% 30% 20% 17 11 10% 0% Dog Cat Bird Fish
Step by Step Solution
There are 3 Steps involved in it
1 Expert Approved Answer
Step: 1 Unlock

Question Has Been Solved by an Expert!
Get step-by-step solutions from verified subject matter experts
Step: 2 Unlock
Step: 3 Unlock