

Question: Interpretation Consider the two graphs depicting the influence of advertisements on making large purchases for two different age groups, those 1834 years old and those
Interpretation Consider the two graphs depicting the influence of advertisements on making large purchases for two different age groups, those 18–34 years old and those 45–54 years old (based on a Harris Poll of about 2500 adults aged 18 or older). Note: Other responses such as “not sure” and “not applicable” were also possible.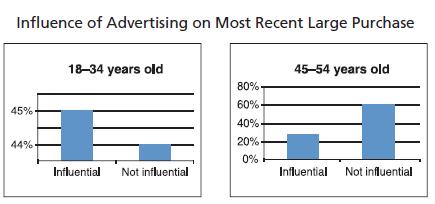
(a) Taking a quick glance at the graphs, Jenna thought that there was very little difference (maybe less than 1%) in the percentage of the two age groups who said that ads were influential. How would you change the graphs so that Jenna would not be misled so easily? Hint: Look at the vertical scales of the two graphs.
(b) Take the information from the two graphs and make a cluster bar graph showing the percentage by age group reporting to be influenced by ads and those reporting they were not influenced by ads.AppendixLO1
Influence of Advertising on Most Recent Large Purchase 18-34 years old 45-54 years old 80% 60% 45% 40% 44% 20%- 0% Influential Not influential Influential Not influential
Step by Step Solution
There are 3 Steps involved in it

Get step-by-step solutions from verified subject matter experts