

Question: Interpretation The ogives shown on the next page are based on U.S. Census data and show the average annual personal income per capita for each
Interpretation The ogives shown on the next page are based on U.S. Census data and show the average annual personal income per capita for each of the 50 states. The data are rounded to the nearest thousand dollars.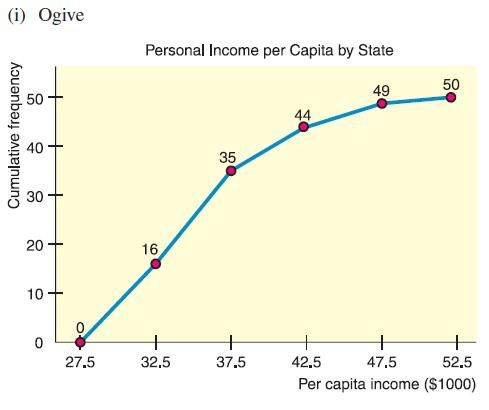
(a) How were the percentages shown in graph (ii)
computed?
(b) How many states have average per capita income less than 37.5 thousand dollars?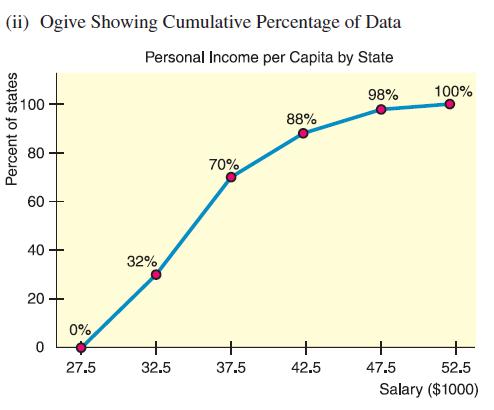
(c) How many states have average per capita income between 42.5 and 52.5 thousand dollars?
(d) What percentage of the states have average per capita income more than 47.5 thousand dollars?AppendixLO1
(i) Ogive Cumulative frequency 40 40 30 30 20 20 10 Personal Income per Capita by State 16 35 49 50 44 + + 52.5 47.5 Per capita income ($1000) 0 + + 27.5 32,5 37.5 42.5
Step by Step Solution
There are 3 Steps involved in it

Get step-by-step solutions from verified subject matter experts