

Question: Interpretation How much time is spent socially interacting with friends in-person? The following histograms are based on different random samples of size 100 drawn from
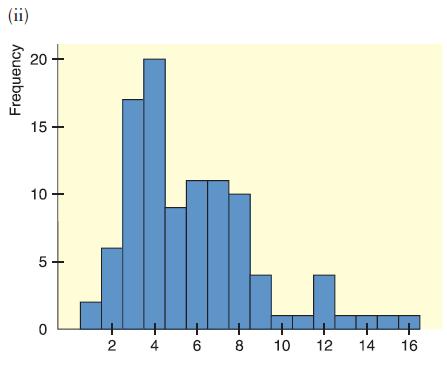
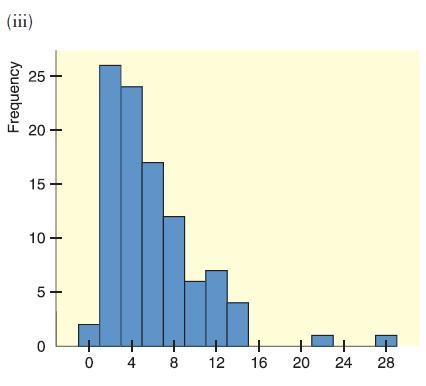
Interpretation How much time is spent socially interacting with friends in-person? The following histograms are based on different random samples of size 100 drawn from the same population on the weekly number of hours an individual spent interacting with friends in-person.
(a) Identify the midpoint of the class with the highest frequency in each of the three histograms.
(b) Using the class midpoints, what is the range of data shown in each histogram?
(c) Which of the histograms are more clearly skewed right?
(d) Based on your study of random samples in Chapter 1, is it surprising to see the variations in the samples as displayed in the histograms?
(e) The original population from which the samples were drawn is skewed right with a high frequency near 4. Do all three random samples seem to reflect these properties equally well?AppendixLO1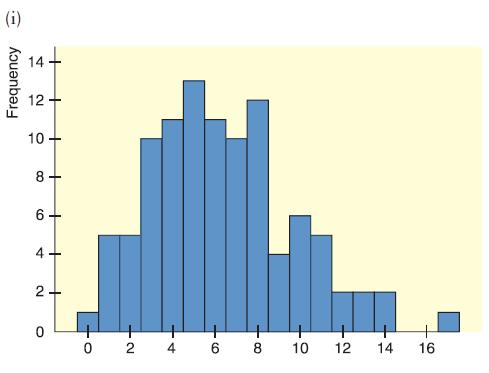
(i) Frequency 14 12- 10 8 6 4+ 2- 0 12 4 16 -8 12 14. 16
Step by Step Solution
There are 3 Steps involved in it

Get step-by-step solutions from verified subject matter experts