

Question: Interpretation Histograms of random sample data are often used as an indication of the shape of the underlying population distribution. Histograms (i), (ii), and (iii)
Interpretation Histograms of random sample data are often used as an indication of the shape of the underlying population distribution. Histograms (i), (ii), and (iii) on this page are based on random samples of size 30, 50, and 100 from the same population.
(i) Sample of size 30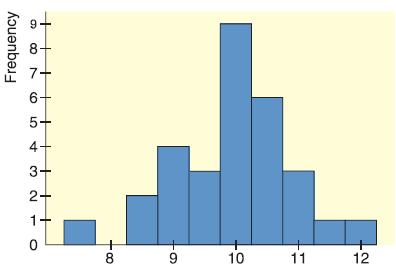 (ii) Sample of size 50
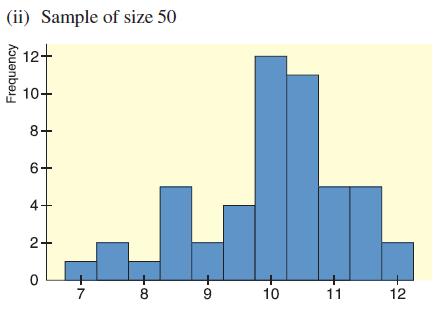 (iii) Sample of size 100
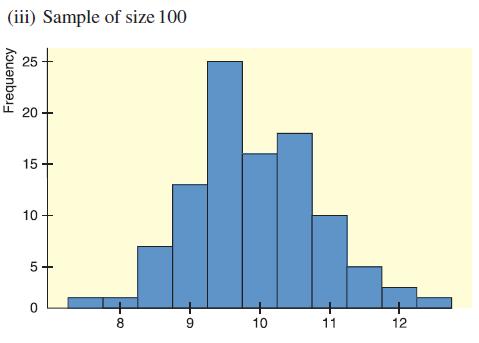
(a) Using the midpoint labels of the three histograms, what would you say about the estimated range of the population data from smallest to largest? Does the bulk of the data seem to be between 8 and 12 in all three histograms?
(b) The population distribution from which the samples were drawn is symmetric and moundshaped, with the top of the mound at 10, 95% of the data between 8 and 12, and 99.7% of data between 7 and 13. How well does each histogram reflect these characteristics?
AppendixLO1
Frequency 9 6. 5- 4- 3- 2- 8 9 10 11 12
Step by Step Solution
There are 3 Steps involved in it

Get step-by-step solutions from verified subject matter experts