

The data points given in Exercises 7 were formed by reversing the slope of the lines in
Question:
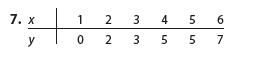
The data points given in Exercises 7 were formed by reversing the slope of the lines in Exercises 5. Plot the points on graph paper and calculate r and r2. Notice the change in the sign of r and the relationship between the values of r2 compared to Exercises 5.
By what percentage was the sum of squares of deviations reduced by using the least-squares predictor yˆ5a1bx rather than y as a predictor of y?
Step by Step Answer:

This question has not been answered yet.
You can Ask your question!
Related Book For 

Introduction To Probability And Statistics
ISBN: 9780357114469
15th Edition
Authors: William Mendenhall Iii , Robert Beaver , Barbara Beaver
Question Posted:
