

Question: The data represent different ways to classify a group of 100 students in a statistics class. Construct a bar chart and pie chart to describe
The data represent different ways to classify a group of 100 students in a statistics class. Construct a bar chart and pie chart to describe each set of data. 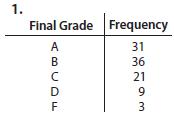
1. Final Grade Frequency ABCDE 31 36 21 9 3
Step by Step Solution
There are 3 Steps involved in it
1 Expert Approved Answer
Step: 1 Unlock

Question Has Been Solved by an Expert!
Get step-by-step solutions from verified subject matter experts
Step: 2 Unlock
Step: 3 Unlock