

The histogram and normal probability plot in Figure 7.10 were constructed based upon a sample of n550
Question:
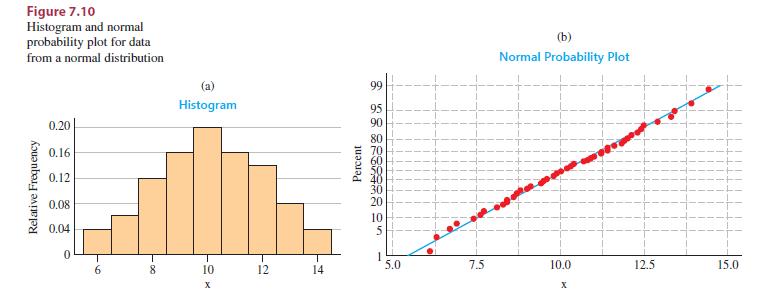
The histogram and normal probability plot in Figure 7.10 were constructed based upon a sample of n550 observations from a normal population with mean m 510 and standard deviation s 52. Comment on the shape of the histogram and whether the normal probability plots can reasonably be described as a straight line.
Step by Step Answer:

This question has not been answered yet.
You can Ask your question!
Related Book For 

Introduction To Probability And Statistics
ISBN: 9780357114469
15th Edition
Authors: William Mendenhall Iii , Robert Beaver , Barbara Beaver
Question Posted:
