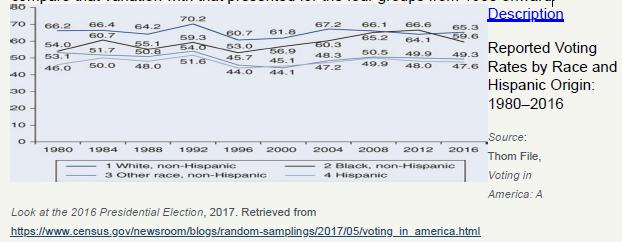
C7. The time-series chart shown below displays trends for presidential election voting rates by race and Hispanic
Question:
C7. The time-series chart shown below displays trends for presidential election voting rates by race and Hispanic origin for 1980–2016. U.S. Census Senior Sociologist Thom File noted how for the first time in the 2012 presidential election, black voting rates exceeded the rates for non-Hispanic whites. However, in the 2016 presidential election, there was a remarkable shift in voting rates by race and Hispanic origin. Describe the variation in voting rates in 2016 for the four racial and Hispanic origin groups and then compare that variation with that presented for the four groups from 1980 onward

Fantastic news! We've Found the answer you've been seeking!
Step by Step Answer:
Related Book For 

Social Statistics For A Diverse Society
ISBN: 9781544339733
9th Edition
Authors: Chava Frankfort Nachmias, Anna Y Leon Guerrero, Georgiann Davis
Question Posted:


