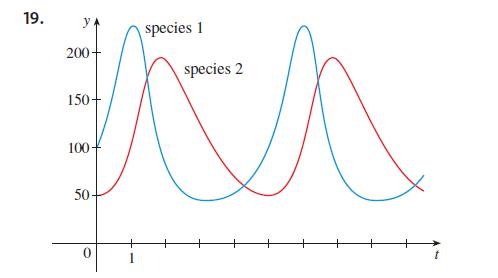
Graphs of populations of two species are shown. Use them to sketch the corresponding phase trajectory. 19.
Question:
Graphs of populations of two species are shown. Use them to sketch the corresponding phase trajectory.
Fantastic news! We've Found the answer you've been seeking!
Step by Step Answer:
Related Book For 

Biocalculus Calculus Probability And Statistics For The Life Sciences
ISBN: 9781305114036
1st Edition
Authors: James Stewart, Troy Day
Question Posted:


