

Question: (a) For the data in Problem 7.1, find the estimated regression line and calculate the R 2 statistic. Comment upon the result. How does it
(a) For the data in Problem 7.1, find the estimated regression line and calculate the R2 statistic. Comment upon the result. How does it compare with Todaro’s findings?
(b) Calculate the standard error of the estimate and the standard errors of the coefficients. Is the slope coefficient significantly different from zero? Comment upon the result.
(c) Test the overall significance of the regression equation and comment.
(d) Taking your own results and Todaro’s, how confident do you feel that you understand the determinants of the birth rate?
(e) What do you think will be the result of estimating your equation using all 26 countries’ data? Try it! What do you conclude?
Problem 7.1
The other data which Todaro might have used to analyse the birth rate were: 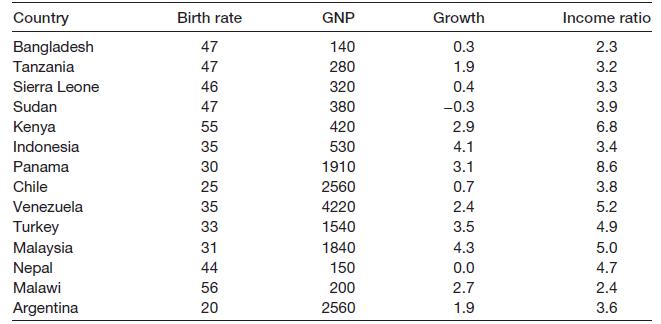
Country Birth rate GNP Growth Income ratio Bangladesh 47 140 0.3 2.3 Tanzania 47 280 1.9 3.2 Sierra Leone 46 320 0.4 3.3 Sudan 47 380 -0.3 3.9 Kenya 55 420 2.9 6.8 Indonesia 35 530 4.1 3.4 Panama 30 1910 3.1 8.6 Chile 25 2560 0.7 3.8 Venezuela 35 4220 2.4 5.2 Turkey Malaysia Nepal Malawi 33 1540 3.5 4.9 31 1840 4.3 5.0 44 150 0.0 4.7 56 200 2.7 2.4 Argentina 20 2560 1.9 3.6
Step by Step Solution
3.48 Rating (184 Votes )
There are 3 Steps involved in it
a Using the data provided in the table we can perform a linear regression analysis to estimate the relationship between birth rate and the independent variables GNP growth and income ratio The estimat... View full answer

Get step-by-step solutions from verified subject matter experts