

Question: Calculate the rank correlation coefficient between price and quantity for the data in Problem 7.2. How does it compare with the ordinary correlation coefficient? Problem
Calculate the rank correlation coefficient between price and quantity for the data in Problem 7.2. How does it compare with the ordinary correlation coefficient?
Problem 7.2
The data below show consumption of margarine (in ounces per person per week) and its real price, for the UK.
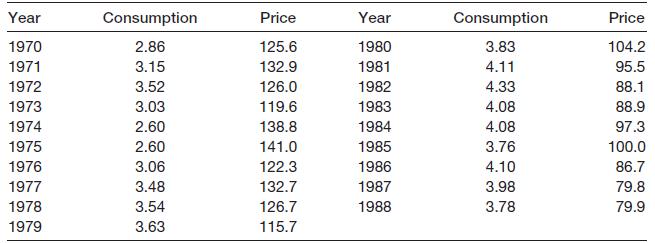
Year Consumption Price Year Consumption Price 1970 2.86 125.6 1980 3.83 104.2 1971 3.15 132.9 1981 4.11 95.5 1972 3.52 126.0 1982 4.33 88.1 1973 3.03 119.6 1983 4.08 88.9 1974 2.60 138.8 1984 4.08 97.3 1975 2.60 141.0 1985 3.76 100.0 1976 3.06 122.3 1986 4.10 86.7 1977 3.48 132.7 1987 3.98 79.8 1978 3.54 126.7 1988 3.78 79.9 1979 3.63 115.7
Step by Step Solution
3.43 Rating (166 Votes )
There are 3 Steps involved in it
ANSWER To calculate the rank correlation coefficient we first need to rank the data for both consumption and price Year Consumption Rank Price Rank 19... View full answer

Get step-by-step solutions from verified subject matter experts