

Question: Two radon detectors were placed in different locations in the basement of a home. Each provided an hourly measurement of the radon concentration, in units
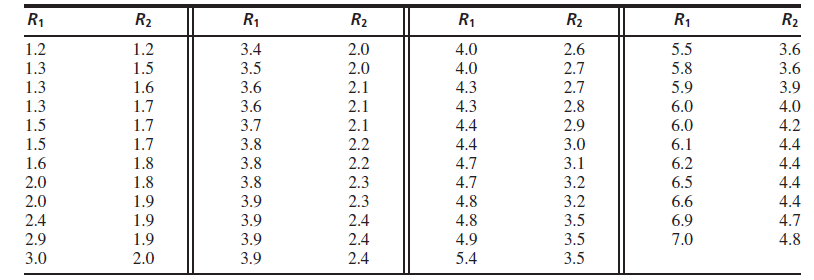
Two radon detectors were placed in different locations in the basement of a home. Each provided an hourly measurement of the radon concentration, in units of pCi/L. The data are presented in the following table.
a. Compute the least-squares line for predicting the radon concentration at location 2 from the concentration at location 1.
b. Plot the residuals versus the fitted values. Does the linear model seem appropriate?
c. Divide the data into two groups: points where R1 1 ?? 4 in the other. Compute the least-squares line and the residual plot for each group. Does the line describe either group well? Which one?
d. Explain why it might be a good idea to fit a linear model to part of these data, and a nonlinear model to the other.
R1 R2 R1 R2 R1 R2 R1 R2 1.2 1.3 1.2 3.4 2.0 4.0 2.6 5.5 3.6 3.5 1.5 1.6 2.0 4.0 2.7 5.8 3.6 1.3 3.6 2.1 4.3 2.7 5.9 3.9 1.3 1.7 3.6 2.1 4.3 2.8 6.0 4.0 1.5 1.7 3.7 2.1 4.4 2.9 6.0 4.2 1.5 1.7 3.8 2.2 4.4 3.0 6.1 4.4 1.6 1.8 3.8 2.2 4.7 3.1 6.2 4.4 2.0 1.8 3.8 2.3 4.7 3.2 6.5 4.4 2.0 1.9 3.9 2.3 4.8 3.2 6.6 4.4 2.4 1.9 3.9 2.4 4.8 3.5 6.9 4.7 2.9 1.9 3.9 2.4 4.9 3.5 7.0 4.8 3.0 2.0 3.9 2.4 5.4 3.5
Step by Step Solution
3.56 Rating (174 Votes )
There are 3 Steps involved in it
a b c t 14 128 020 P 050 A computer package gives P 0221 t 13 0690 P 050 A compu... View full answer

Get step-by-step solutions from verified subject matter experts