

Question: Refer to Exercise 7.84 and the Analytical Chemistry (Dec. 15, 2009) study in which scientists used high-performance liquid chromatography to determine the amount of drug
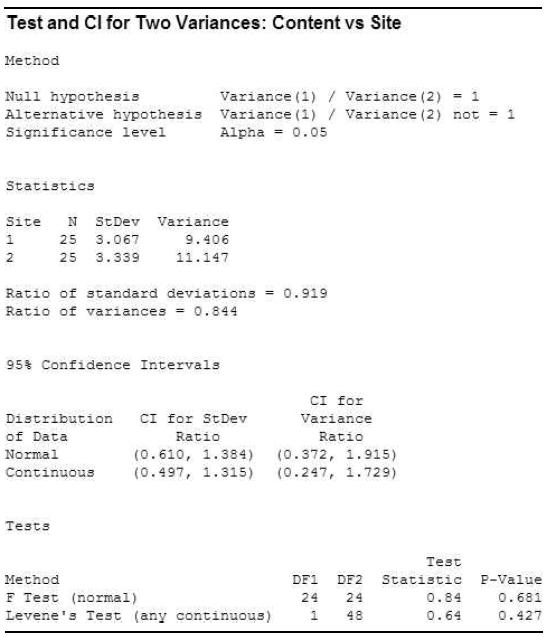
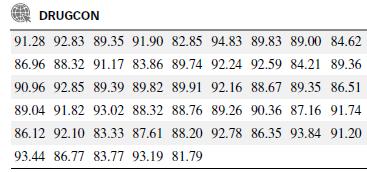
Refer to Exercise 7.84 and the Analytical Chemistry (Dec. 15, 2009) study in which scientists used high-performance liquid chromatography to determine the amount of drug in a tablet. Recall that 25 tablets were produced at each of two different, independent sites. In Exercise 7.84 you used a 95% confidence interval to determine if the two sites produce drug concentrations with different variances. Now make the inference with a test of hypothesis at Use the information provided in the MINITAB printout.
Data from Exercise 7.84
Refer to Exercise 7.39 and the Analytical Chemistry (Dec. 15, 2009) study in which scientists used high-performance liquid chromatography to determine the amount of drug in a tablet. Recall that 25 tablets were produced at each of two different, independent sites. The researchers want to determine if the two sites produce drug concentrations with different variances.
Test and Cl for Two Variances: Content vs Site Method Null hypothesis Alternative hypothesis Variance (1) / Variance (2) not = 1 Significance level Variance (1) / Variance (2) 1 Alpha = 0.05 Statistics Site StDev Variance 1 25 3.067 9.406 2 25 3.339 11.147 Ratio of standard deviations = 0.919 Ratio of variances 0.844 95% Confidence Intervals CI for CI for StDev Variance Distribution of Data Ratio Ratio Normal (0.610, 1.384) (0.372, 1.915) Continuous (0.497, 1.315) (0.247, 1.729) Tests Test Method DF1 DF2 Statistic P-Value F Test (normal) Levene's Test (any continuous) 24 24 0.84 0.681 1 48 0.64 0.427
Step by Step Solution
3.44 Rating (160 Votes )
There are 3 Steps involved in it

Get step-by-step solutions from verified subject matter experts