Drug content assessment. Refer to Exercise 5.68 (p. 287) and the Analytical Chemistry (Dec. 15, 2009) study
Question:
Drug content assessment. Refer to Exercise 5.68 (p. 287)
and the Analytical Chemistry (Dec. 15, 2009) study in which scientists used high-performance liquid chromatography to
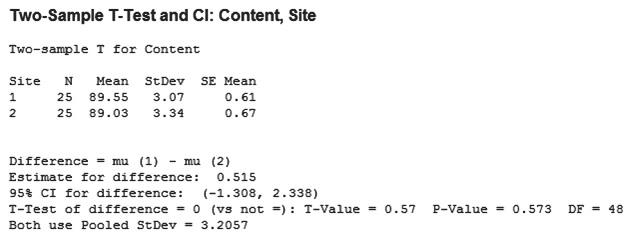
determine the amount of drug in a tablet. Twenty-five tablets were produced at each of two different, independent sites. Drug concentrations (measured as a percentage) for the tablets produced at the two sites are listed in the accompanying table. The scientists want to know whether there is any difference between the mean drug concentration in tablets produced at Site 1 and the corresponding mean at Site 2. Use the MINITAB printout above to help the scientists draw a conclusion.
Site 1 91.28 92.83 89.35 91.90 82.85 94.83 89.83 89.00 84.62 86.96 88.32 91.17 83.86 89.74 92.24 92.59 84.21 89.36 90.96 92.85 89.39 89.82 89.91 92.16 88.67 Site 2 LO5 89.35 86.51 89.04 91.82 93.02 88.32 88.76 89.26 90.36 87.16 91.74 86.12 92.10 83.33 87.61 88.20 92.78 86.35 93.84 91.20 93.44 86.77 83.77 93.19 81.79
Step by Step Answer:

This question has not been answered yet.
You can Ask your question!