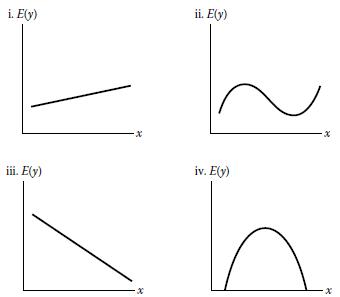
The accompanying graphs depict pth-order polynomials for one quantitative independent variable. a. For each graph, identify the
Question:
The accompanying graphs depict pth-order polynomials for one quantitative independent variable.
a. For each graph, identify the order of the polynomial.
b. Using the parameters β0, β1, β2, etc., write an appropriate model relating E(y) to x for each graph.
c. The signs (+ or -) of many of the parameters in the models of part b can be determined by examining the graphs. Give the signs of those parameters that can be determined.

Step by Step Answer:
Related Book For 

Statistics For Engineering And The Sciences
ISBN: 9781498728850
6th Edition
Authors: William M. Mendenhall, Terry L. Sincich
Question Posted:


