

1.15 A simple histogram is also a useful chart as a quality improvement tool. The frequency histogram...
Question:
1.15 A simple histogram is also a useful chart as a quality improvement tool. The frequency histogram of quality measurements on the diameters of 500 steel rods is given in Figure below.
These rods had a lower specification limit (LSL)
of 1.0 centimeter, and rods with diameters under the LSL were declared defective.
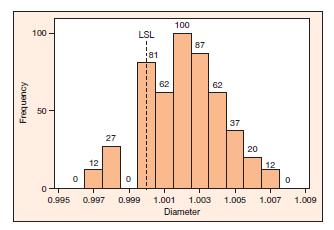
a What percent of rods were declared defective?
b Do you see anything unusual in this histogram?
Can you offer a possible explanation of what is happening here?
Fantastic news! We've Found the answer you've been seeking!
Step by Step Answer:

Answered By
JAPHETH KOGEI
Hi there. I'm here to assist you to score the highest marks on your assignments and homework. My areas of specialisation are:
Auditing, Financial Accounting, Macroeconomics, Monetary-economics, Business-administration, Advanced-accounting, Corporate Finance, Professional-accounting-ethics, Corporate governance, Financial-risk-analysis, Financial-budgeting, Corporate-social-responsibility, Statistics, Business management, logic, Critical thinking,
So, I look forward to helping you solve your academic problem.
I enjoy teaching and tutoring university and high school students. During my free time, I also read books on motivation, leadership, comedy, emotional intelligence, critical thinking, nature, human nature, innovation, persuasion, performance, negotiations, goals, power, time management, wealth, debates, sales, and finance. Additionally, I am a panellist on an FM radio program on Sunday mornings where we discuss current affairs.
I travel three times a year either to the USA, Europe and around Africa.
As a university student in the USA, I enjoyed interacting with people from different cultures and ethnic groups. Together with friends, we travelled widely in the USA and in Europe (UK, France, Denmark, Germany, Turkey, etc).
So, I look forward to tutoring you. I believe that it will be exciting to meet them.
2+ Reviews
10+ Question Solved
Related Book For 
Probability And Statistics For Engineers
ISBN: 9781133006909
5th Edition
Authors: Richard L Scheaffer, Madhuri Mulekar, James T McClave, Cecie Starr
Question Posted:
