

4. (a) The following are results of fuel economy tests (miles per gallon) obtained from a sample...
Question:
4.
(a) The following are results of fuel economy tests (miles per gallon) obtained from a sample of 50 automobiles in 1975:
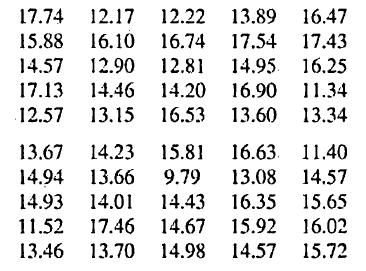
Plot the histogram of these data and calculate the sample average and sample standard deviation.
(b) The following 50 results were obtained in 1985:
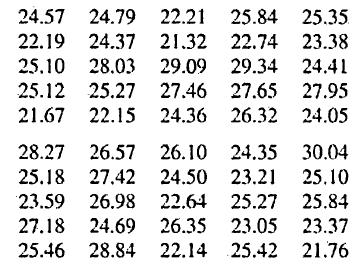
Plot the histogram of these data and calculate the sample average and sample standard deviation. Considering both data sets, comment on any interesting aspects you find. Make a list of questions you would like answered that would allow you to investigate further.
Step by Step Answer:

This question has not been answered yet.
You can Ask your question!
Related Book For 

Statistics For Experimenters Design Innovation And Discovery
ISBN: 9780471718130
2nd Edition
Authors: George E. P. Box, J. Stuart Hunter, William G. Hunter
Question Posted:
