

Question: Plot the following time series to determine which of the trend models appears to fit better. Period Time Series Period Time Series 3 49 47
Plot the following time series to determine which of the trend models appears to fit better.
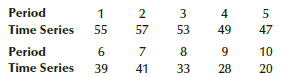
Period Time Series Period Time Series 3 49 47 53 57 55 8 10 41 39 28 33 20 4. 2.
Step by Step Solution
★★★★★
3.47 Rating (154 Votes )
There are 3 Steps involved in it
1 Expert Approved Answer
Step: 1 Unlock

The linear trend mode... View full answer
Question Has Been Solved by an Expert!
Get step-by-step solutions from verified subject matter experts
Step: 2 Unlock
Step: 3 Unlock
Document Format (2 attachments)
1429_6054778a8675d_661496.pdf
180 KBs PDF File
1429_6054778a8675d_661496.docx
120 KBs Word File