

Question: Refer to Exercise 20.19. Use regression analysis to calculate the linear and quadratic trends. Which line fits better? In exercise 20.19 Plot the following time
Refer to Exercise 20.19. Use regression analysis to calculate the linear and quadratic trends. Which line fits better?
In exercise 20.19
Plot the following time series to determine which of the trend models appears to fit better.
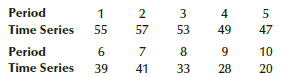
Period Time Series Period Time Series 3 49 47 53 57 55 8 10 41 39 28 33 20 4. 2.
Step by Step Solution
★★★★★
3.52 Rating (155 Votes )
There are 3 Steps involved in it
1 Expert Approved Answer
Step: 1 Unlock

y 6387 394t R 2 94 y ... View full answer
Question Has Been Solved by an Expert!
Get step-by-step solutions from verified subject matter experts
Step: 2 Unlock
Step: 3 Unlock
Document Format (2 attachments)
1429_6054778a86628_661494.pdf
180 KBs PDF File
1429_6054778a86628_661494.docx
120 KBs Word File