

Question: The following table, stored in Smartphone Sales , represents the quarterly market share (percentage) of smartphones, by type, for the third quarter of 2017 through
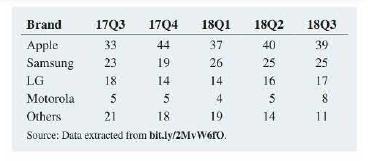
The following table, stored in Smartphone Sales , represents the quarterly market share (percentage) of smartphones, by type, for the third quarter of 2017 through the third quarter of 2018, as reported by Counterpoint Research.
a. What conclusions can you reach about the market for smartphones in the third quarter of 2017 through the third quarter of 2018?
b. What differences are there in the third quarter of 2017 through the third quarter of 2018?
Brand 17Q3 17Q4 18Q1 18Q2 18Q3 Apple 33 44 37 40 39 23 Samsung LG 19 26 25 25 18 14 14 16 17 Motorola 5 5 4 Others 21 18 19 14 11 Source: Data extracted from bitly/2MvWoro.
Step by Step Solution
3.50 Rating (170 Votes )
There are 3 Steps involved in it
Answer a The conclusions relatedto the market of Q3 of 2018 are A... View full answer

Get step-by-step solutions from verified subject matter experts