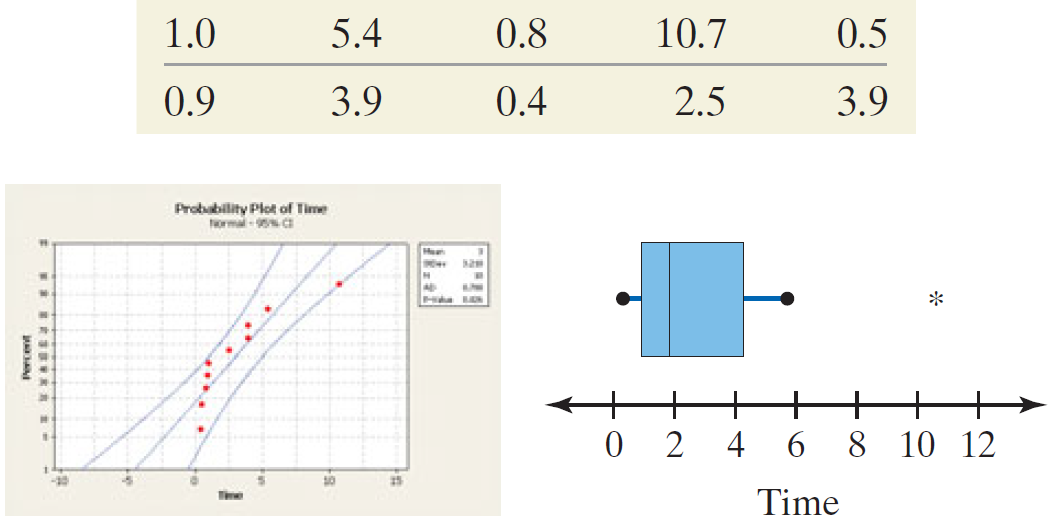
A police officer hides behind a billboard to catch speeders. The following data represent the number of
Question:
A police officer hides behind a billboard to catch speeders. The following data represent the number of minutes he waits before first observing a car that is exceeding the speed limit by more than 10 miles per hour on 10 randomly selected days:

Transcribed Image Text:
0.8 1.0 5.4 10.7 0.5 3.9 0.9 0.4 2.5 3.9 Probability Plot of Time tormal- C + + + 4 6. 8 10 12 + -30 Time
Fantastic news! We've Found the answer you've been seeking!
Step by Step Answer:
Answer rating: 76% (13 reviews)
The box plot indicate...View the full answer

Answered By

Krishnavendra Y
I am a self motivated financial professional knowledgeable in; preparation of financial reports, reconciling and managing accounts, maintaining cash flows, budgets, among other financial reports. I possess strong analytical skills with high attention to detail and accuracy. I am able to act quickly and effectively when dealing with challenging situations. I have the ability to form positive relationships with colleagues and I believe that team work is great key to performance. I always deliver quality, detailed, original (0% plagiarism), well-researched and critically analyzed papers.
5.00+
4+ Reviews
10+ Question Solved
Related Book For 

Statistics Informed Decisions Using Data
ISBN: 9780321757272
4th Edition
Authors: Michael Sullivan III
Question Posted:
Students also viewed these Mathematics questions
-
The following data represent the number of minutes customers at Wendys had to wait in the drive through line before their order was taken. 1 4 6 0 4 3 10 0 4 Calculate the z-scores for the following...
-
The following data represent the number of miles per gallon achieved on the highway for small cars for the model year 2011. (a) Construct a stem-and-leaf plot and (b) Describe the shape of the...
-
The following data represent the number of licensed drivers in various age groups and the number of fatal accidents within the age group by gender. (a) On the same graph, draw a scatter diagram for...
-
In a recombinant protein expression process the host microorganism, Pichia pastoris needs to be separated from the culture supernatant after production. A pilot scale bioreactor with a working volume...
-
What is posting?
-
Atom A has 35 protons and 44 neutrons in its nucleus. Atom B has 35 protons and 46 neutrons in its nucleus. Should we expect similar or different chemical properties for these atoms? Explain.
-
(Use a spreadsheet or similar computational tool.) Consider a one-period economy with 5 possible states and 5 assets traded. The state-contingent dividends and prices of the assets and the state...
-
The following are summary cash transactions that occurred during the year for Hilliard Healthcare Co. (HHC): Cash Received from: Customers ........ $660,000 Interest on note receivables .. 12,000...
-
What is the purpose of the qualified business income deduction? Explain how it is calculated. (2018 tax rules)
-
MMs CFO is trying to understand the new revenue recognition model and has asked you to explain how MM would account for the above scenario under the new standard. 1. How should MM account for the...
-
The following data represent the prices for a 4 GB flash memory card from online retailers. Treat these data as a simple random sample of all online retailers. In Problem 35 from Section 9.2, it was...
-
A random sample of recent graduates of law school was obtained in which the graduates were asked to report their starting salary. The data, based on results reported by the National Association for...
-
Refer to the data in Exercise 69 for CompuDesk. Assume in this exercise that the company uses absorption costing. In Exercise 69, CompuDesk, Inc., makes an oak desk specially designed for personal...
-
do you agree wih this approach to dismantling the toxic culture? explain
-
Movies When randomly selecting a speaking character in a movie, the probability of getting a female is 0.331 (based on data from "Inequality in 1200 Popular Films," by Smith, et al., Annenberg...
-
Steve Reese is a well-known interior designer in Fort Worth, Texas. He wants to start his own business and convinces Rob O'Donnell, a local merchant, to contribute the capital to form a partnership....
-
Exercise 6-10A (Algo) Double-declining-balance and units-of-production depreciation: gain or loss on disposal LO 6-3, 6-4, 6-5 Exact Photo Service purchased a new color printer at the beginning of...
-
Independent Events Again assume that when randomly selecting a speaking character in a movie, the probability of getting a female is 0.331, as in Exercise 1. If we want to find the probability of 20...
-
Vista Company sold for $98,000 cash land originally costing $70,000. The company recorded a gain on the sale of $28,000. How is this event reported in a statement of cash flows using the indirect...
-
For the vector whose polar components are (Vr = 1, Vθ = 0), compute in polars all components of the second covariant derivative Vα;μ;ν. To find...
-
What is meant by the phrase degrees of freedom as it pertains to the computation of the sample standard deviation?
-
In one of Sullivans statistics sections, the standard deviation of the heights of all students was 3.9 inches. The standard deviation of the heights of males was 3.4 inches and the standard deviation...
-
Explain how standard deviation measures spread. In your explanation include the computation of the same standard deviation for two data sets: Data set 1:3,4,5; Data set 2:0,4,8.
-
What is the risk profile of your company? (How much overall risk is there in this firm? Where is this risk coming from (market, firm, industry or currency)? (APPLE COMPANY LATEST DATA) How is the...
-
What is the duration for the following bond with annual payments? 5.6300 5.7957 4.9894 5.1910 5.3806
-
DOLLAR TREE GROCERY OUTLET Short-Term Liquidity 2021 2022 2021 2022 Current Ratio 1.35 1.51 1.86 1.67 Quick Ratio 0.24 0.15 0.63 0.42 Cash Ratio Cash Conversion Cycle 34.78 45.75 19.41 21.61 Days...

Study smarter with the SolutionInn App


