All Matches
Solution Library
Expert Answer
Textbooks
Search Textbook questions, tutors and Books
Oops, something went wrong!
Change your search query and then try again
Toggle navigation
FREE Trial
S
Books
FREE
Tutors
Study Help
Expert Questions
Accounting
General Management
Mathematics
Finance
Organizational Behaviour
Law
Physics
Operating System
Management Leadership
Sociology
Programming
Marketing
Database
Computer Network
Economics
Textbooks Solutions
Accounting
Managerial Accounting
Management Leadership
Cost Accounting
Statistics
Business Law
Corporate Finance
Finance
Economics
Auditing
Hire a Tutor
AI Tutor
New
Search
Search
Sign In
Register
study help
mathematics
statistics informed decisions
Questions and Answers of
Statistics Informed Decisions
In Problems, determine the F-test statistic based on the given summary statistics
In Problems, determine the F-test statistic based on the given summary statistics.
In problems, fill in the ANOVA table.
Use a graphing calculator or statistical software to simulate rolling a six-sided die 100 times, using an integer distribution with numbers one through six.(a) Use the results of the simulation to
Conduct a survey in your school by randomly asking 50 students whether they drive to school. Based on the results of the survey, approximate the probability that a randomly selected student drives to
Use a graphing calculator or statistical software to simulate the playing of the game of roulette, using an integer distribution with numbers 1 through 38. Repeat the simulation 100 times. Let the
Why does the test for homogeneity follow the same procedures as the test for independence?
Mark Twain, in his book Life on the Mississippi (1884), makes the following observation:Therefore, the Mississippi between Cairo and New Orleans was twelve hundred and fifteen miles long one hundred
Using statistical software or a graphing calculator with advanced statistical features, randomly generate a sequence of 20 integer values, each either 0 or 1. Conduct a runs test at the a = 0.05
(a) Simulate obtaining a random sample of 20 individuals from a normal population with mean 50 and standard deviation 10.(b) Use the data to construct a 95% confidence interval for the mean using
The exponential probability distribution can be used to model waiting time in line or the lifetime of electronic components. Its density function is skewed right. Suppose the wait-time in a line can
Use the probability distribution from Problem 20 and a DISCRETE command for some statistical software to simulate 100 repetitions of the experiment. Approximate the mean and standard deviation of the
Sullivan Survey Choose a qualitative variable from the Sullivan Survey. Build a probability model for the variable.
Explain the meaning of Legendre’s quote given on page 210.
Choose a quantitative variable from the Sullivan Survey and check it for outliers.
Choose any quantitative variable from the Sullivan Survey. Now choose a qualitative variable, such as gender or political philosophy. Determine the range and standard deviation by the qualitative
Choose any two quantitative variables from the Sullivan Survey for which a comparison is reasonable, such as number of hours of television versus number of hours of Internet. Draw a histogram for
Sullivan Survey Choose any quantitative variable from the Sullivan Survey. Now choose a qualitative variable, such as gender or political philosophy. Determine the mean and the median by the
Choose any quantitative variable from the Sullivan Survey. Draw a histogram of the data. Determine the mean and the median. Based on the mean, median, and histogram, describe the shape of the
Choose a continuous quantitative variable from the Sullivan StatCrunch survey data set and obtain an appropriate graphical summary of the variable.
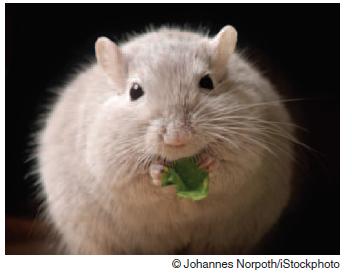
Light at Night and Weight Gain A study described in Data A.1 on page 136 found that mice exposed to light at night gained substantially more weight than mice who had complete darkness at night,
HowBig Is the Difference in Homes For Sale? The dataset HomesForSale has data on houses available for sale in three Mid-Atlantic states (NY, NJ, and PA) as well as California (CA). In Exercise C.63
Prostate Cancer and a Drug for Baldness Exercise A.30 on page 149 introduces a study in which the drug finasteride, marketed as Propecia to help protect against male pattern baldness, is investigated
Near Death Experiences Exercise 2.21 on page 56 describes a study of the prevalence of near-death experiences. A near-death experience includes the sensation of seeing a bright light or feeling
Close Confidants and Social Networking Sites Exercise 6.116 on page 386 introduced a study in which 2006 randomly selected US adults (age 18 or older) were asked to give the number of people in the
Test to see if there is evidence that the lie detector says a person is lying more than 50% of the time, regardless of what the person reads.The twoway table indicates whether the participants were
Is There a Genetic Marker for Dyslexia? Exercise 2.20 on page 56 describes a study finding that a gene disruption may be related to an increased risk of developing dyslexia. Researchers studied the
Is there evidence that the mean number of free throw attempts per game by the Heat is different from the mean for all NBA teams? Assume that the mean number of free throws attempted by teams in all
Results from the Student Survey Data 1.1 on page 4 describes a dataset giving results of a student survey. We use the students who filled out the survey as a sample from the population of all
Posture and Pain Research shows that people adopting a dominant pose have reduced levels of stress and feel more powerful than those adopting a submissive pose. Furthermore, it is known that if
Randomization Distribution for Heart Rate and Blood Pressure Use StatKey or other technology to create the randomization distribution for the data in Exercise B.50. Use the distribution to estimate
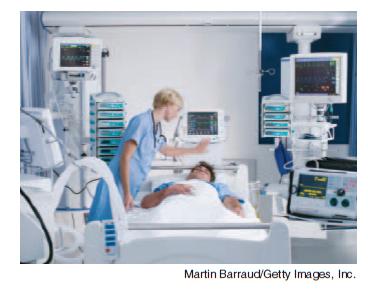
Heart Rates and Blood Pressure Table B.7 shows the heart rates and systolic blood pressure for eight 55-year-old patients from the Intensive Care Unit data introduced in Data 2.3 on page 66 and
A Randomization Distribution for Mercury Levels in Fish Use StatKey or other technology to create the randomization distribution for the situation in Exercise B.48. Use the distribution to calculate
Confidence Intervals for Correlation using Atlanta Commutes In Exercise 3.85 on page 204, we use the standard error to construct a 95% confidence interval for the correlation between Distance (in
Studies suggest that when young men interact with a woman who is in the fertile period of her menstrual cycle, they pick up subconsciously on subtle changes in her skin tone, voice, and scent. A new
Data A.1 on page 136, we introduce a study in which mice are randomly separated into one group on a normal light–dark cycle and one group with bright light all the time. Although the mice ate the
If factor A has 2 levels and factor B has 3 levels in a two-way ANOVA, we have a a ___x_____factorial design.
Treat the results of the Sullivan Statistics Survey as a random sample of adult Americans. The individuals were asked to disclose their political philosophy (conservative, moderate, liberal) as well
How is a matched-pairs design related to the randomized complete block design?
What does randomized mean in the randomized complete block design? What does complete mean in the randomized complete block design?
What is blocking? Why might a researcher want to block?
True or False: The F-test statistic is F0 = MST/MSE.
The variability within each treatment group, which is a weighted average of the sample variances from each treatment where the weights are based on the size of each sample, is called the mean square
The variability among the sample means is called ___________ sample variability, and the variability of each sample is the ___________ sample variability.
True or False: To perform a one-way ANOVA, the populations must have the same variance.
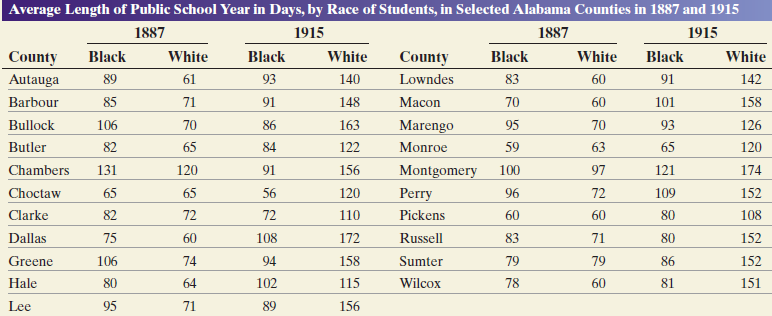
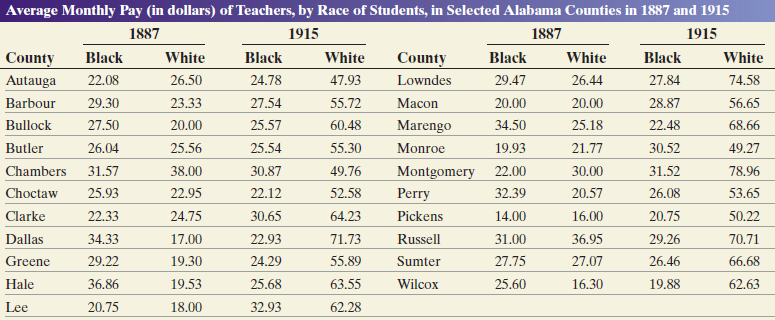
Use the Wilcoxon matched-pairs signed-ranks test procedure with an a = 0.05 significance level to answer the following questions:1. In 1887, was the median school-year length different for black and
Explain what it means if a nonparametric test has an efficiency of 0.713.
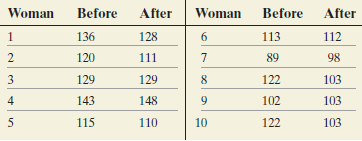
A physical therapist wants to investigate whether a new exercise program reduces the pulse rate of subjects. She randomly selects 10 women to participate in the study. Each subject is asked to step
The division from which the winner of the National Basketball Association’s champion came for the years 1985 to 2010 is given in the following list, where the Western Division is represented by a W
The division from which the winner of the Stanley Cup came for the years 1985 to 2010 is given in the following list, where the Western Division is represented by a W and the Eastern Division is
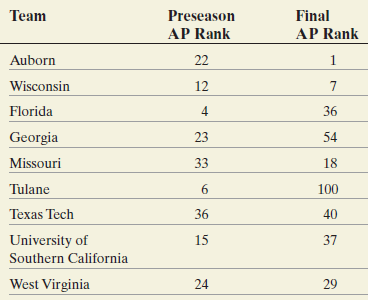
A sports reporter wants to determine if the preseason Associated Press (AP) poll is positively related to the final AP poll. The following data represent the preseason and final AP rankings for a
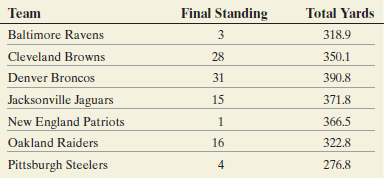
Defense wins championships” is a common phrase used in the National Football League. Is defense associated with winning? The following data represent the final standing of a team based on winning
Explain the primary difference between the Wilcoxon signedranks test and the Mann–Whitney test.
Use the Mann–Whitney test to test the given hypotheses at the a = 0.05 level of significance. The independent samples were obtained randomly.Hypotheses: H0: Mx = My versus H1: Mx > My with n1 =
Use the Mann–Whitney test to test the given hypotheses at the a = 0.05 level of significance. The independent samples were obtained randomly.Hypotheses: H0: Mx = My versus H1: Mx ≠ My with n1 =
Use the Mann–Whitney test to test the given hypotheses at the a = 0.05 level of significance. The independent samples were obtained randomly.Hypotheses: H0: Mx = My versus H1: Mx > My with n1 =
Use the Mann–Whitney test to test the given hypotheses at the a = 0.05 level of significance. The independent samples were obtained randomly.Hypotheses: H0: Mx = My versus H1: Mx < My with n1 =
A student in an exercise science program wishes to study dietary habits of married couples. She surveys married couples from her local gym and asks them (individually) what percent of their daily
The Wilcoxon matched-pairs signedranks test to test the given hypotheses at the a = 0.05 level of significance. The dependent samples were obtained randomly.Hypotheses: H0: MD = 0 versus H1: MD
The Wilcoxon matched-pairs signedranks test to test the given hypotheses at the a = 0.05 level of significance. The dependent samples were obtained randomly.Hypotheses: H0: MD = 0 versus H1: MD ≠ 0
The Wilcoxon matched-pairs signedranks test to test the given hypotheses at the a = 0.05 level of significance. The dependent samples were obtained randomly.Hypotheses: H0: MD = 0 versus H1: MD <
When conducting a left-tailed Wilcoxon matched-pairs signedranks test, the test statistic is T = ____________.
Respondents for the survey in Problem 18 were selected from those who agreed to participate in Harris Interactive Surveys. The survey’s methodology includes the following statement: “Because the
Determine the P-value of the hypothesis test performed in Problem 10.Data from Problem 10The Web site zillow.com allows us to research real estate listings. One neat feature of the site is the
Determine the P-value of the hypothesis test performed in Problem 9.Data from Problem 9The median salary of a teacher in Illinois is $57,283 according to TeacherSalaryInfo.com. The state of Illinois
Determine the P-value of the hypothesis test performed in Problem 8.Data from problem 8A sociologist feels that the median age at which women marry in Cook County, Illinois, is less than the median
Determine the P-value of the hypothesis test performed in Problem 7.Data from Problem 7In 2002, the median pH level of the rain in Glacier National Park, Montana, was 5.25. A biologist thinks that
The following data represent the salaries of 14 randomly selected baseball players in the 2010 season (data are in thousands of dollars, so 3250 means $3,250,000).Test the hypothesis that the median
In 2002, the median pH level of the rain in Glacier National Park, Montana, was 5.25. A biologist thinks that the acidity of rain has decreased since then. (This would mean that the pH level of the
Hideki Okajima is a relief pitcher for the Boston Red Sox. He throws a two-seam fastball pitch (T) to complement his tremendous split-finger pitch (S). One night, Okajima threw 20 pitches. The
In a runs test for randomness, we let ______________ represent thesample size of which there are two mutually exclusive types; ______________represent the number of observations of the firsttype;
A ______________is a sequence of similar events, items, or symbols that is followed by an event, item, or symbol that is mutually exclusive from the first event, item, or symbol.
Why is it appropriate to call nonparametric statistical procedures distribution-free procedures?
Explain the concept of the power of a test.
Suppose a multiple regression model is given by y^ = 4.39x1 - 8.75x2 + 34.09. An interpretation of the coefficient of x1 would be, “if x1 increases by 1 unit, then the response variable will
If the correlation between two explanatory variables is high, the least-squares regression model may suffer from _________________.
A _______________ shows the linear correlation between each pair of variables under consideration in a multiple regression model.
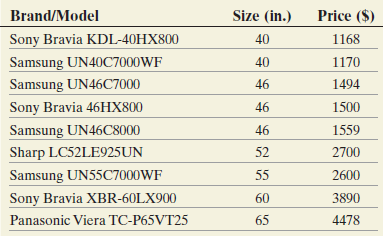
One factor that influences the cost of a 3D television is its size. The following data represent the size and price for a random sample of 3D televisions of varying brands and models.(a) Draw a
Use the results of Problem 17 in Section 14.1 to answer the following questions:(a) What is the mean rate of return for United Technologies stock if the rate of return of the S&P 500 is
What is an interaction plot? Why are they useful?
To graphically display the role interaction plays in a factorial design, we draw _____________.
If changes in the level of factor A result in different changes in the value of the response variable for different levels of factor B, we say there is an_______________.
The effect of factor A is the change in the response variable that results from changing the level of factor A. The effect of factor B is the change in the response variable that results from
What do the y-coordinates on the least-squares regression line represent?
The following table summarizes the sample mean earnings, in thousands of dollars, of a random sample of year-round, full-time workers by gender and age.(a) Construct an interaction plot for the
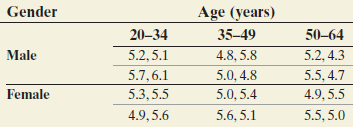
A manufacturing researcher wants to determine if age or gender significantly affects the time required to learn an assembly line task. He randomly selected 24 adults aged 20 to 64 years old, of whom
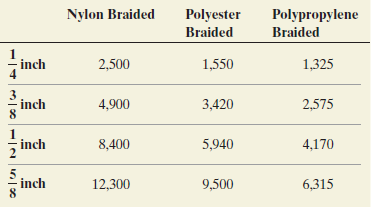
A rock climber wishes to test the tensile strength of three different types of braided ropes. She knows that the rope thickness can make a difference, so she decides to block by thickness. The
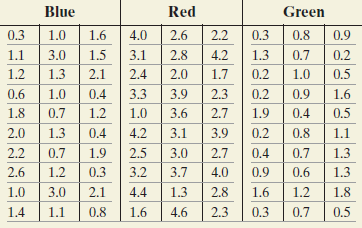
Which type of light results in the tallest rosemary plants after 38 days of growth? To answer this question, Joliet Junior College student Michael Bueno planted 90 rosemary seeds in plant pods. He
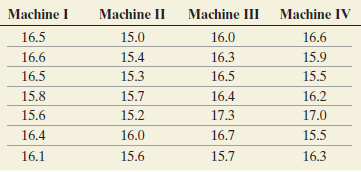
Many fast-food restaurants use automatic soft-drink dispensing machines that fill cups once an order is placed at a drive-through window. A regional manager for a fast-food chain wants to determine
True or False: To perform a one-way ANOVA, the populations do not need to be normally distributed.
The procedures for constructing a t-interval are robust. Explain what this means.
IQ scores based on the Wechsler Intelligence Scale for Children (WISC) are known to be normally distributed with μ = 100 and σ = 15.How many of the intervals do you expect to include the population
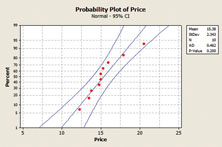
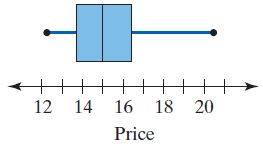
After scanning the UPC code of a 4 GB flash memory card using his smartphone, Michael Sullivan received the following prices for the goods at a variety of online retailers. Treat these data as a
Showing 1 - 100
of 226
1
2
3