

Question: Determine the P-value of the hypothesis test performed in Problem 8. Data from problem 8 A sociologist feels that the median age at which women
Determine the P-value of the hypothesis test performed in Problem 8.
Data from problem 8
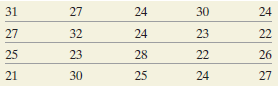
A sociologist feels that the median age at which women marry in Cook County, Illinois, is less than the median age throughout the United States (25.8, obtained from data from the U.S. Census Bureau). Based on a random sample of 20 marriage certificates from the county, she obtains the ages shown in the following table:
Do the data support the sociologist’s feelings at the a = 0.05 level of significance?
We can use the P-value approach when determining whether or not to reject the null hypothesis regarding a median by using the sign test. Recall that the P-value is the probability of observing a test statistic as extreme or more extreme than what was actually observed, under the assumption that the null hypothesis is true.
In the sign test, we assume that the median is M0, so 50% of the data should be less than M0 and 50% of the data greater than M0. So we expect half of the data to result in minus signs and half of the data to result in plus signs. We can think of the data as a bunch of plus and minus signs that follow a binomial probability distribution with p = ½ if the null hypothesis is true. So the P-value is computed from the binomial probability formula, with X = k and n equal to the number of plus and minus signs:
P-value = P(X ≤ k) = nCk0.5k(1 - 0.5)n-k + nCk-10.5k-1(1 - 0.5)n-(k-1) + ∙ ∙ ∙ + nC0(1 - 0.5)n
For Example 1 in this section, the P-value is
P-value = P(X ≤ 8) = 20C8 ∙ 0.58 ∙ (1 - 0.5)20-8 + 20C7 ∙ 0.57 ∙ (1 - 0.5)13 + ∙ ∙ ∙ + 20C0(1 - 0.5)20 = 0.2517
Because the P-value is greater than the level of significance, a = 0.05, we do not reject the null hypothesis. These binomial probabilities are easiest to compute with statistical software or a graphing calculator with advanced statistical features.
31 24 27 30 24 22 27 24 23 32 23 25 28 22 26 21 30 27 25 24
Step by Step Solution
3.44 Rating (176 Votes )
There are 3 Steps involved in it
Pvalue P X k P X 9 calc... View full answer

Get step-by-step solutions from verified subject matter experts